Website Analytics Dashboard
Welcome to our Website Analytics Dashboard – your comprehensive platform for gaining valuable insights into your website’s performance, user behavior, and overall online presence. Immerse yourself in a visual journey that empowers you to make data-driven decisions, optimize your digital strategy, and elevate the success of your online endeavors.
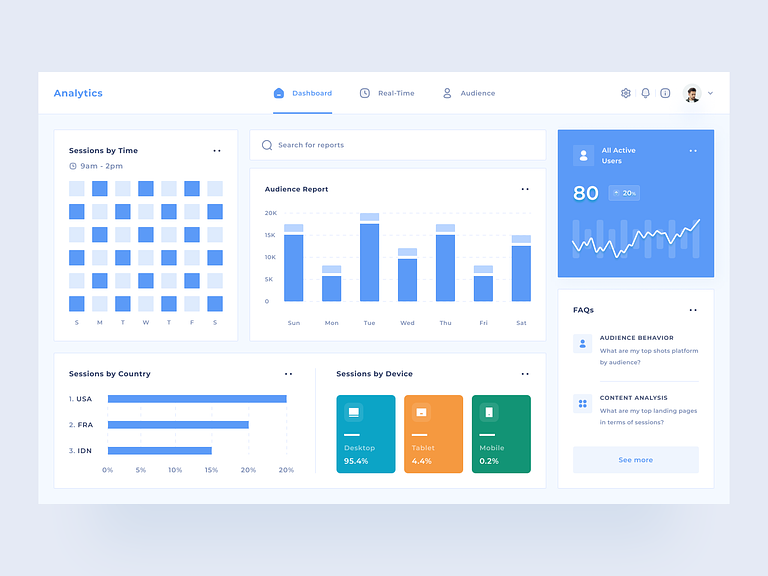
Real-Time Data Visualization:
At the heart of our Website Analytics Dashboard is real-time data visualization that transforms complex website metrics into clear and actionable insights. Engage with dynamic charts, graphs, and visual representations that provide an instant snapshot of your website’s performance, allowing you to stay informed about key metrics at a glance.
User-Friendly Interface for Intuitive Exploration:
Navigate through a user-friendly interface designed for intuitive exploration. Our dashboard is crafted to ensure that users of all levels can effortlessly interact with the analytics, allowing you to delve deeper into specific metrics, track trends, and gain a comprehensive understanding of how users interact with your website.
Comprehensive Performance Metrics:
Explore a diverse range of performance metrics tailored to meet your analytical needs. From website traffic and user demographics to page views and conversion rates, our dashboard provides a holistic view of your website’s health. Gain insights into what resonates with your audience and identify areas for improvement.
Customizable Reports for In-Depth Analysis:
Engage with customizable reports that empower you to conduct in-depth analysis based on your unique objectives. Tailor your reports to focus on specific timeframes, audience segments, or key performance indicators. Our dashboard ensures that you have the flexibility to extract the insights that matter most to your business goals.
Responsive Design for Seamless Access:
Experience the flexibility of our Website Analytics Dashboard with its responsive design. Whether you’re accessing the dashboard from a desktop, tablet, or smartphone, the interface adapts to provide an optimal viewing experience. Stay connected and monitor your website’s performance from anywhere, at any time.
Conversion Funnel Visualization:
Dive into the visualization of conversion funnels, tracking the user journey from entry to conversion. Identify potential bottlenecks, optimize user flow, and enhance the user experience to boost conversion rates. The conversion funnel visualization is a powerful tool for understanding and improving the effectiveness of your website.
In conclusion, welcome to our Website Analytics Dashboard – where data meets visual clarity to empower you with actionable insights. Explore, analyze, and leverage the power of analytics to refine your digital strategy and achieve online success. Your journey to data-driven decision-making starts here.
Want to collaborate? Email Us: hello@keitoto.com
Keitoto | Behance | Instagram | UI8


