In the dynamic world of investments, having a comprehensive and intuitive tool to monitor and analyze your portfolio is paramount. Enter the Investment Dashboard – a finely crafted interface designed for investors seeking clarity, control, and insights into their financial journey. This article explores the key features of an investment dashboard that empowers users to report investments, track gains, analyze profits through charts, and visualize property holdings.
Overview of the Investment Dashboard
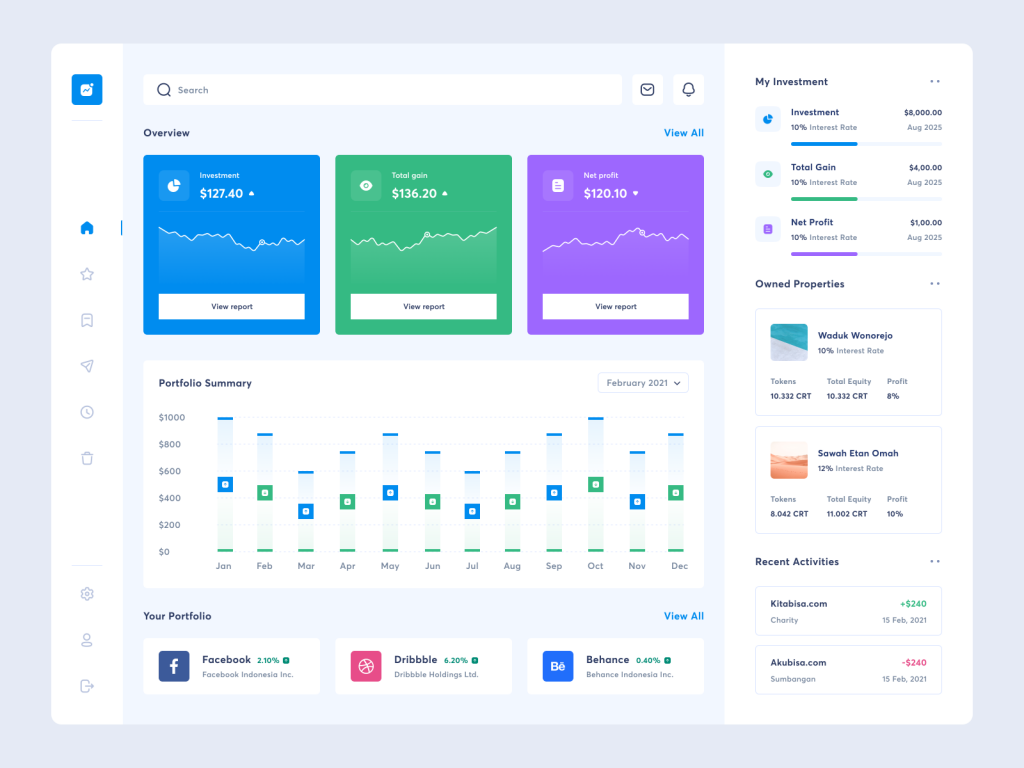
The Investment Dashboard is not just a tool; it’s a financial compass that guides investors through the intricacies of their portfolios. Its user-friendly interface simplifies the complexities of financial management, providing a holistic view of investments and empowering users to make informed decisions.
Reporting Investments with Precision
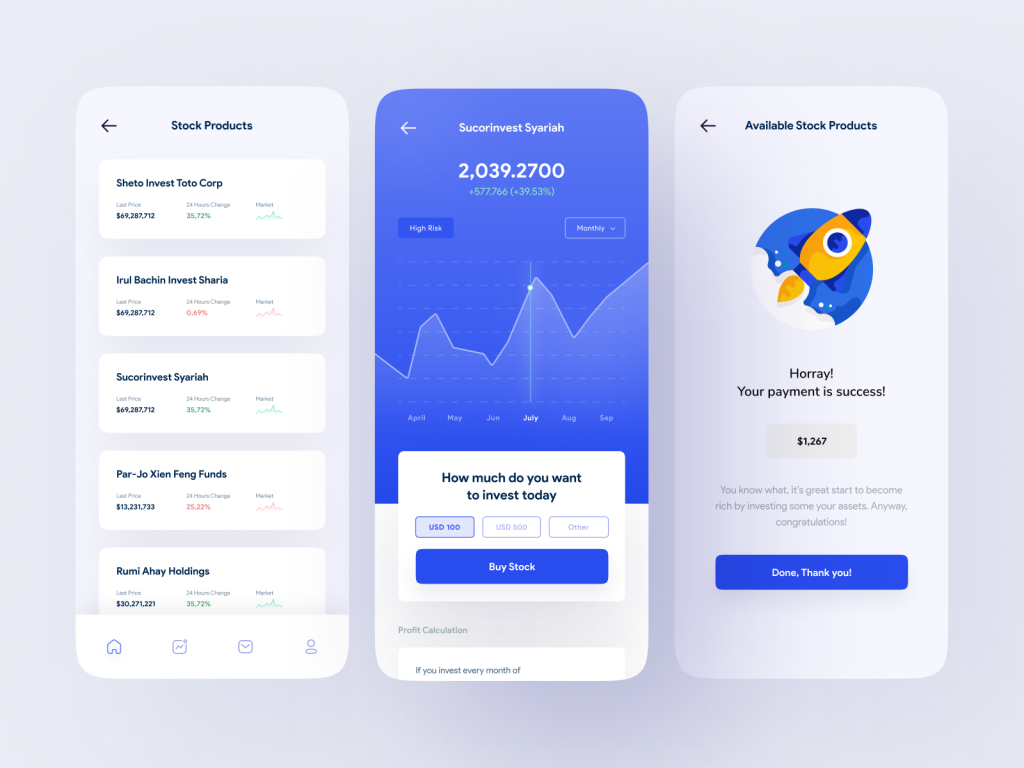
One of the primary functionalities of the Investment Dashboard is the ability to report investments seamlessly. Users can input data related to their investments, including details such as asset type, acquisition cost, and current value. This feature ensures that the dashboard is a real-time reflection of the investor’s financial landscape.
Total Gain and Net Profit Visualization
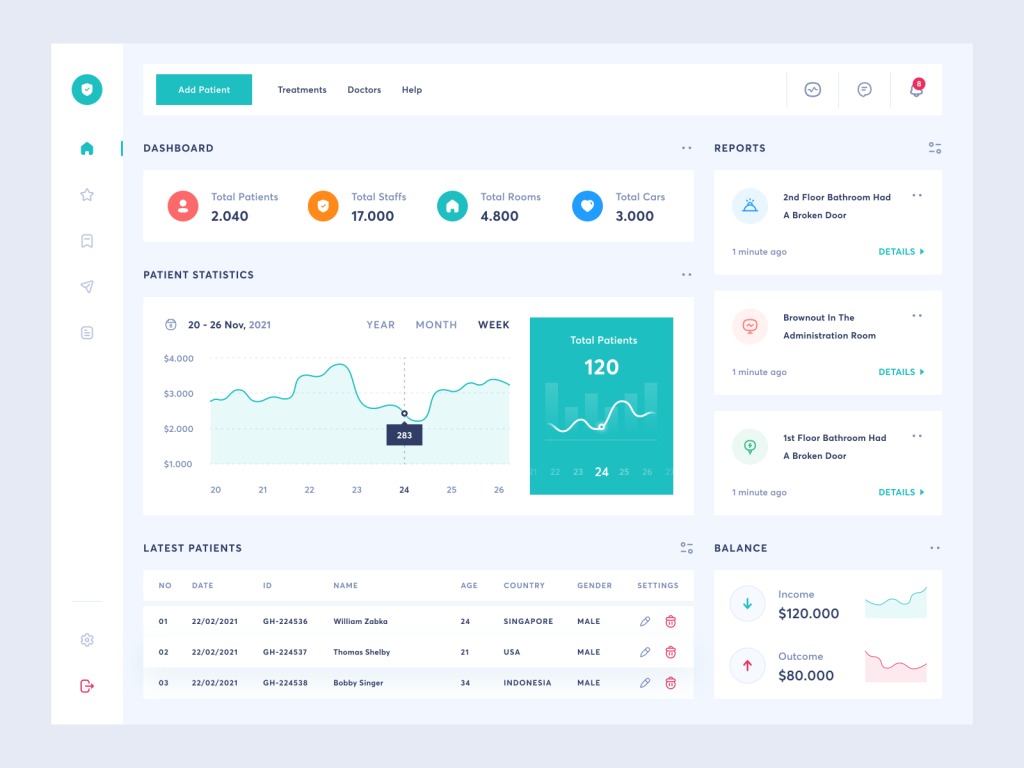
The Investment Dashboard transforms raw financial data into meaningful insights. Users can easily track their total gains and net profits through interactive charts and graphs. Visual representations of investment performance make it easy to identify trends, allowing investors to adjust their strategies for optimum financial growth.
Portfolio Summary by Graphic Charts
The true power of the Investment Dashboard lies in its ability to present complex information in a visually digestible format. Investors can assess their portfolio summary per month through graphic charts.
Displaying insightful property holdings
Users can view property details, current market values, and the overall contribution of real estate assets to their investment portfolio. This feature ensures a complete and transparent view of their financial landscape.
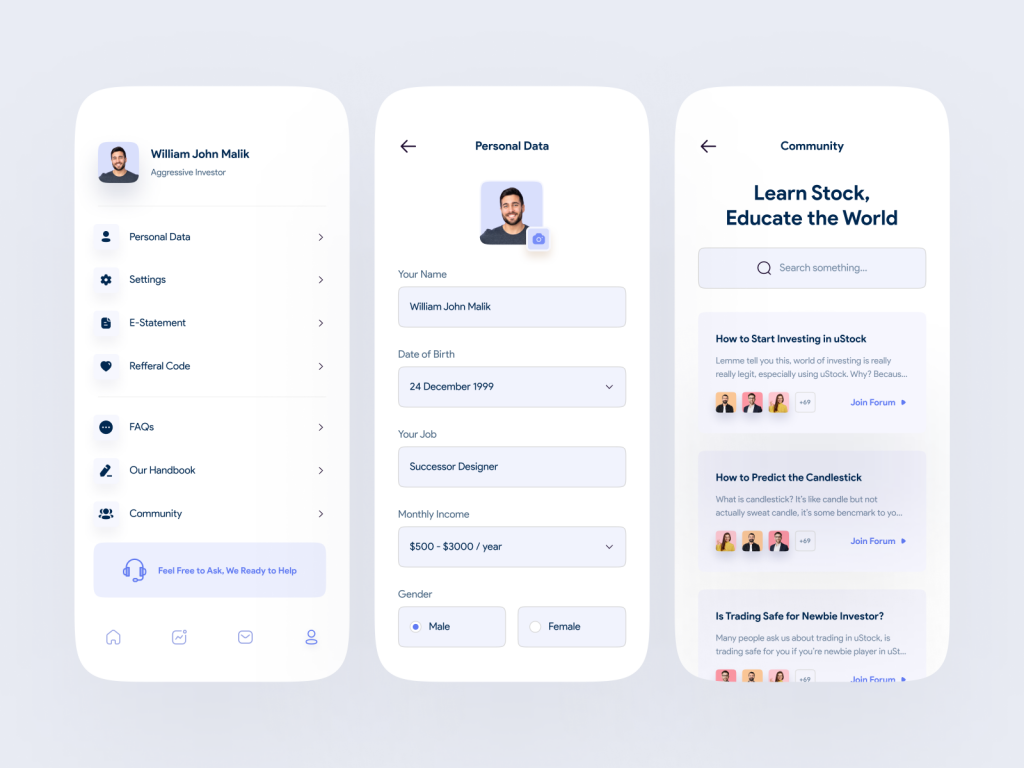
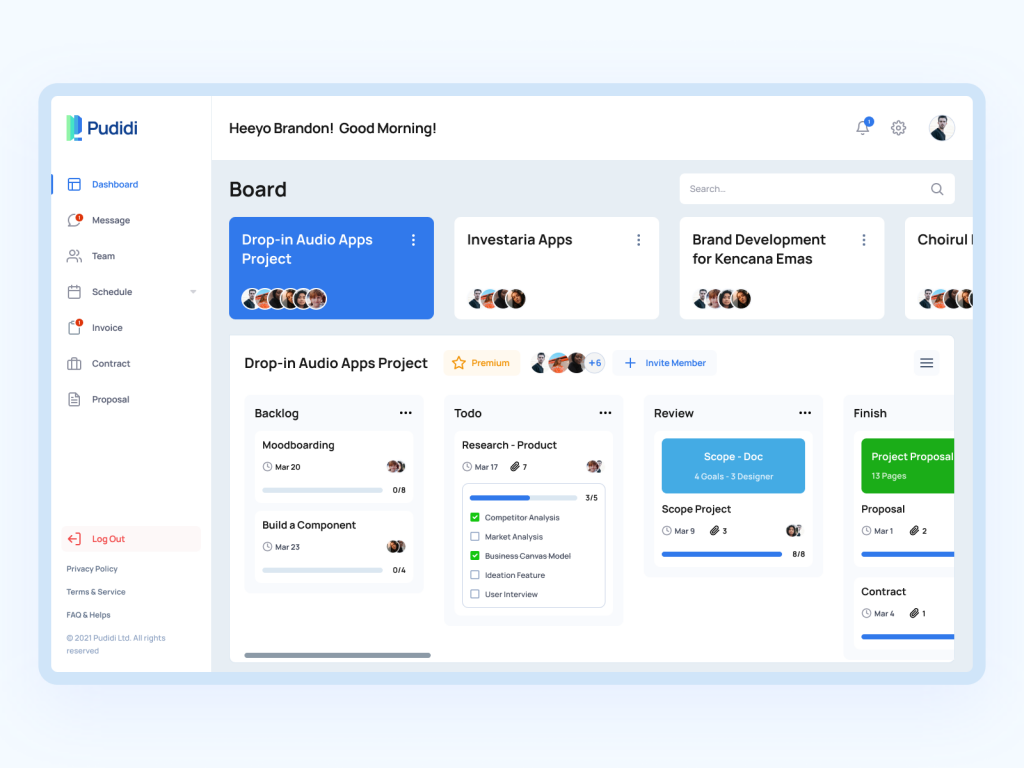
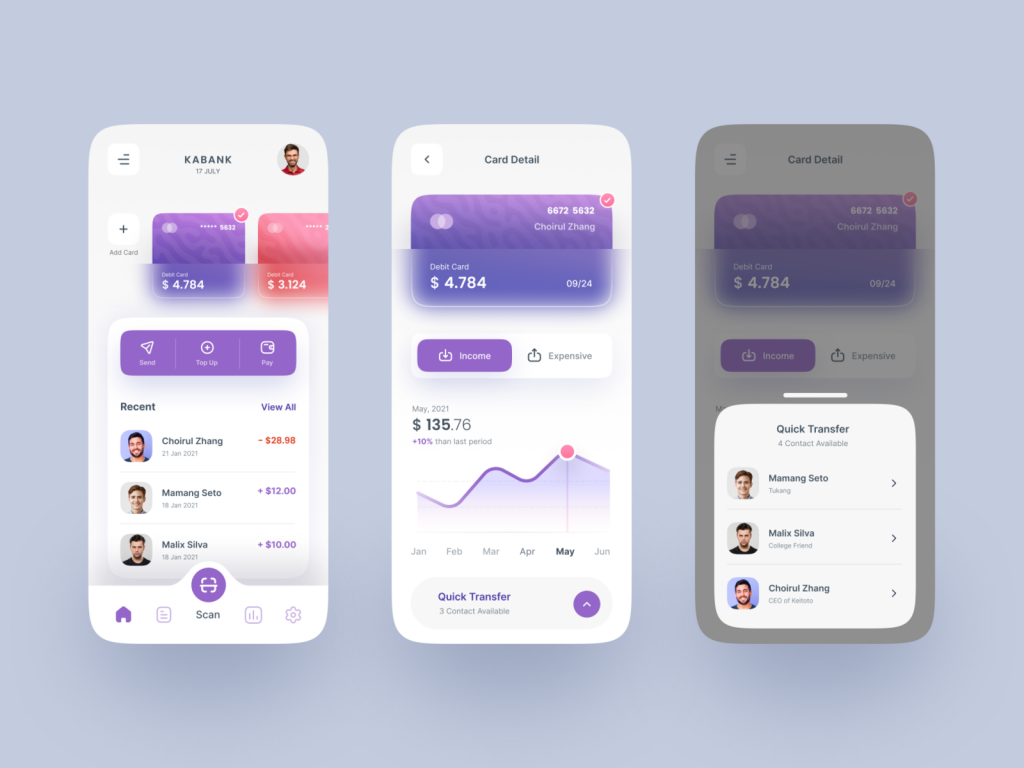
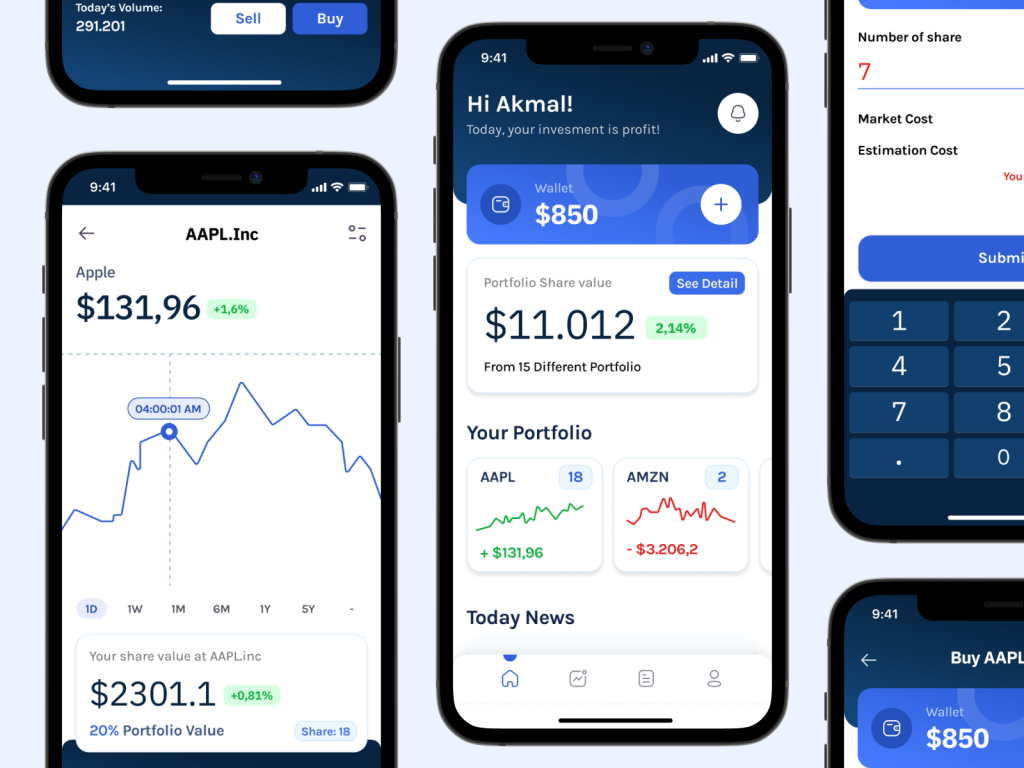
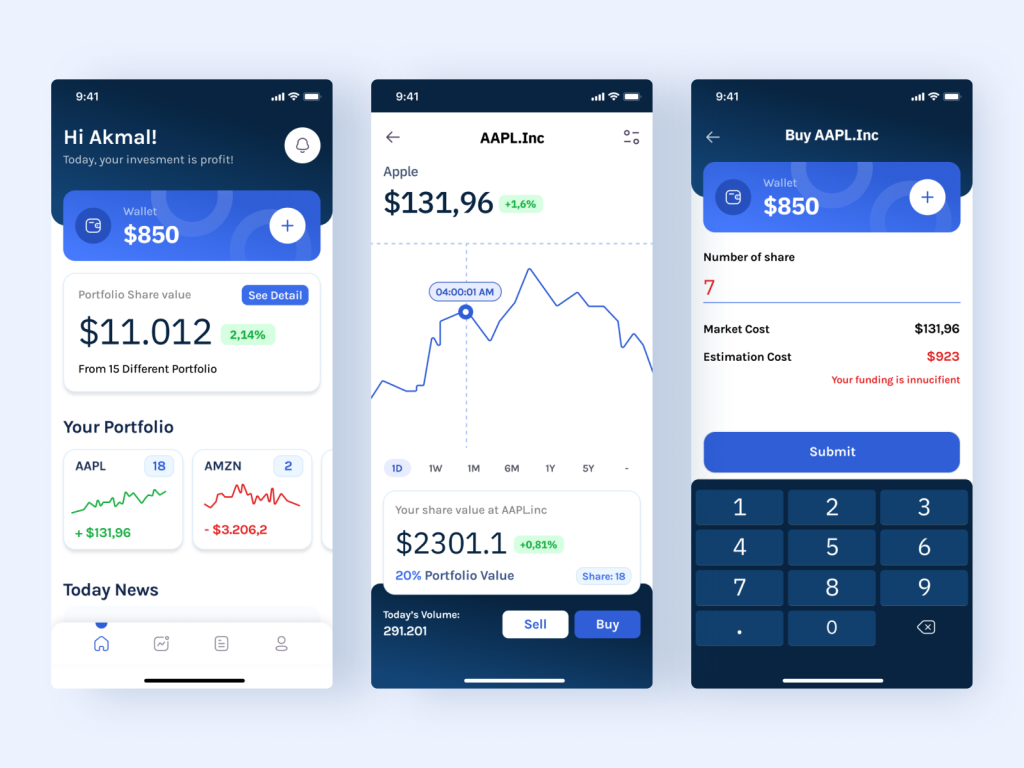
User-Friendly Interface for Intuitive Navigation
Designed for ease of use, the features an intuitive interface that allows users to navigate effortlessly. Whether accessing the dashboard from a desktop or mobile device, the responsive design ensures a consistent and user-friendly experience.
Embrace the future of financial management with an investment dashboard design that transforms data into actionable insights, propelling investors toward prosperity.
Want to collaborate? Email Us: hello@keitoto.com
Plan your work today with Keitoto.